
Generating elevation profiles
Draw a line across the terrain, read the elevation profile chart and its statistics, link the chart to the 3D view, and export the profile as CSV.
You will learn
- Draw a profile line with several points.
- Read the profile chart and its statistics.
- Export the profile as a CSV table.
Prerequisites
Data for this tutorial
Nanda Devi massif, SRTM (real terrain) Download nanda-devi-srtm-1arcsec.tif
- Format
- GeoTIFF, 1 band, Int16, Deflate, tiled
- CRS
- EPSG:4326 (WGS 84, longitude/latitude)
- Content
- Elevations 2285 to 7801 m above the EGM96 geoid; lon 79.7276 to 79.9776, lat 30.2279 to 30.4779
- In Orbis3D
- Data panel ▸ Sample data ▸ Nanda Devi massif, SRTM (real terrain) ▸ Load
- Licence
- SRTM 1 arc-second, NASA/USGS, public domain
Synthetic samples are CC0 1.0; the SRTM sample is public domain. About the datasets
The task
You want a cross-section across the Nanda Devi massif: how high the ridges are, how deep the valleys, how much climbing a route would involve.
Steps
- Load Nanda Devi massif.
- Choose the profile tool: the chart button in the toolbar, Analysis ▸ Elevation profile, or P. A banner at the top of the viewport explains the tool.
- Click a first point on the terrain, then a second. The Elevation profile panel opens at the bottom with the chart. Click more points to extend the line; the profile follows all segments.
- Move the pointer over the chart. A white dot shows the same place on the terrain, and a tooltip gives the distance and elevation. With the chart focused, use the left and right arrow keys instead.
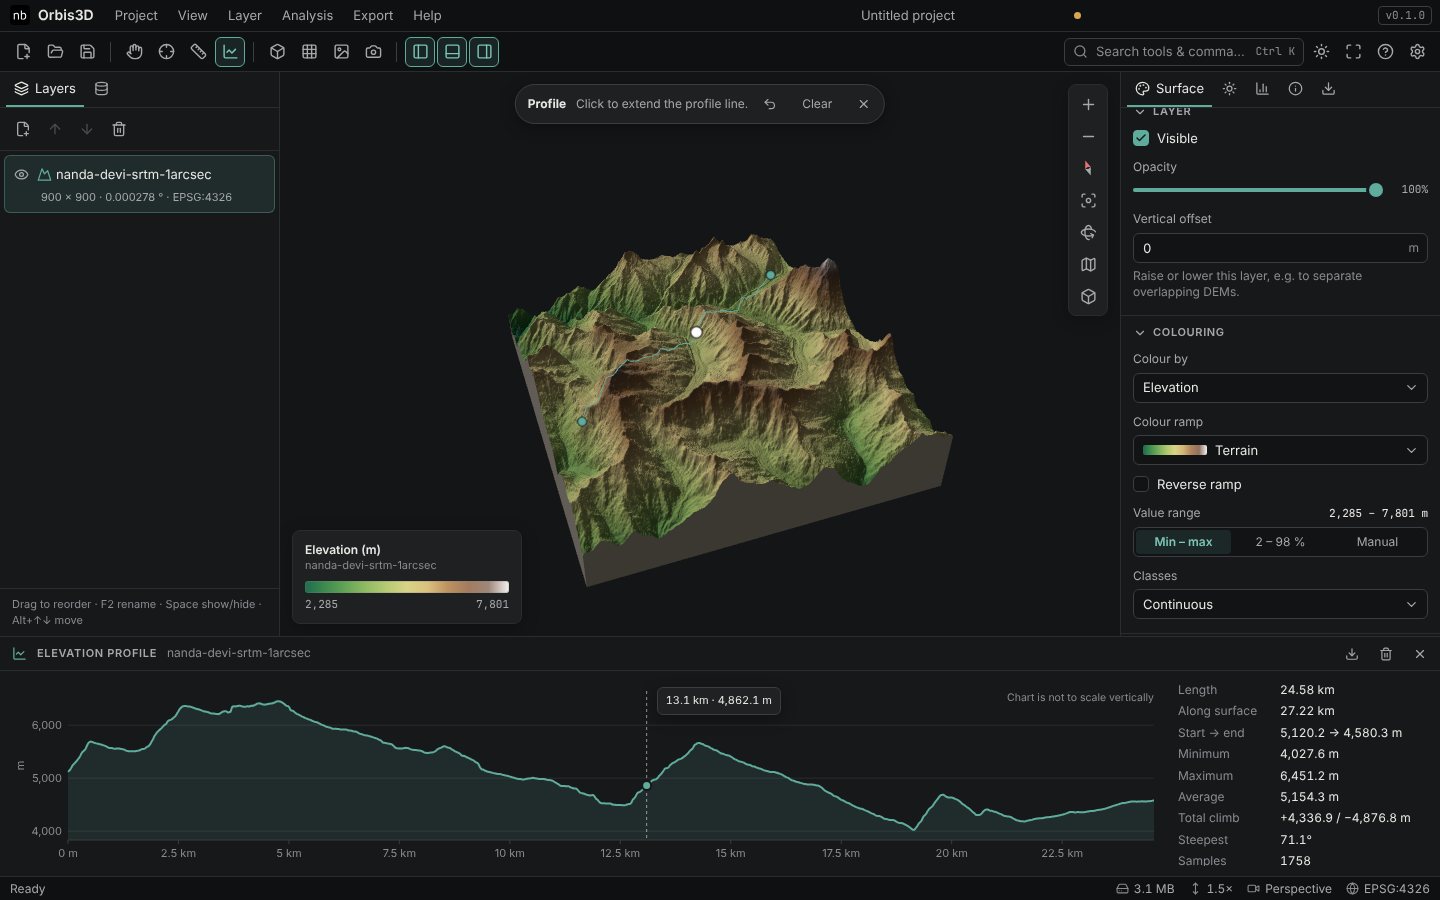
- Read the statistics beside the chart: Length, Along surface, Start → end, Minimum, Maximum, Average, Total climb (up and down), Steepest and the number of Samples.
- Press Backspace or the undo button in the banner to remove the last point; Clear removes the line. Press Esc or double-click to stop the tool.
- Click the download button of the profile panel (or Export ▸ Export profile as CSV) to save the samples.
Expected result
A line of about 25 km across the massif gives a profile between roughly 4,000 and 6,500 m with several thousand metres of climb, for example: length 24.58 km, along surface 27.22 km, minimum 4,027.6 m, maximum 6,451.2 m and 71.1° at the steepest point. Your numbers depend on where you click.
How the profile is sampled
- About two samples per cell along the line, at least 64 and at most 4,096.
- Elevations are interpolated bilinearly from the working grid; samples over NoData leave gaps in the chart.
- Distances are true ground distances: geodesic on the WGS 84 ellipsoid for geographic and Web Mercator DEMs, and planar in the CRS unit converted to metres for projected DEMs.
- Along surface adds the vertical change between samples; Steepest is the steepest gradient between neighbouring samples.
- Clicking off the terrain. Points must be on the terrain; clicks on the background are ignored.
- Mixing layers. A profile stays on the layer of its first point. Clear it to start one on another layer.