
Measuring distances and inspecting coordinates
Read the coordinates and elevation of any point, measure horizontal and along-surface distances, and understand how distances are computed.
You will learn
- Inspect a point's coordinates, cell and elevation.
- Measure a path in horizontal and surface distance.
- Know which distance method each coordinate system uses.
Prerequisites
Data for this tutorial
Sample valley DEM (synthetic) Download orbis3d-sample-valley.tif
- Format
- GeoTIFF, 1 band, Float32, Deflate, tiled
- CRS
- EPSG:32643 (WGS 84 / UTM zone 43N)
- Content
- Elevations 419.5 to 1452.5 m; NoData -9999 in the south-west corner
- In Orbis3D
- Data panel ▸ Sample data ▸ Sample valley DEM (synthetic) ▸ Load
- Licence
- Synthetic, CC0 1.0
Synthetic samples are CC0 1.0; the SRTM sample is public domain. About the datasets
The task
You want the exact elevation and coordinates of a spot in the sample valley, and the length of a planned path along the valley side.
Inspect a point
- Load the sample valley.
- Choose the inspect tool: the crosshair button in the toolbar, Analysis ▸ Inspect point, or I.
- Click the terrain. A card shows:
- the elevation at the point (interpolated from the working grid);
- the cell value: the exact value of that cell, read from the file;
- X and Y in the layer's CRS, and Lat, lon when the CRS can be converted (UTM, Web Mercator; geographic DEMs show longitude and latitude directly);
- the cell (column and row of the full-resolution raster) and the CRS.
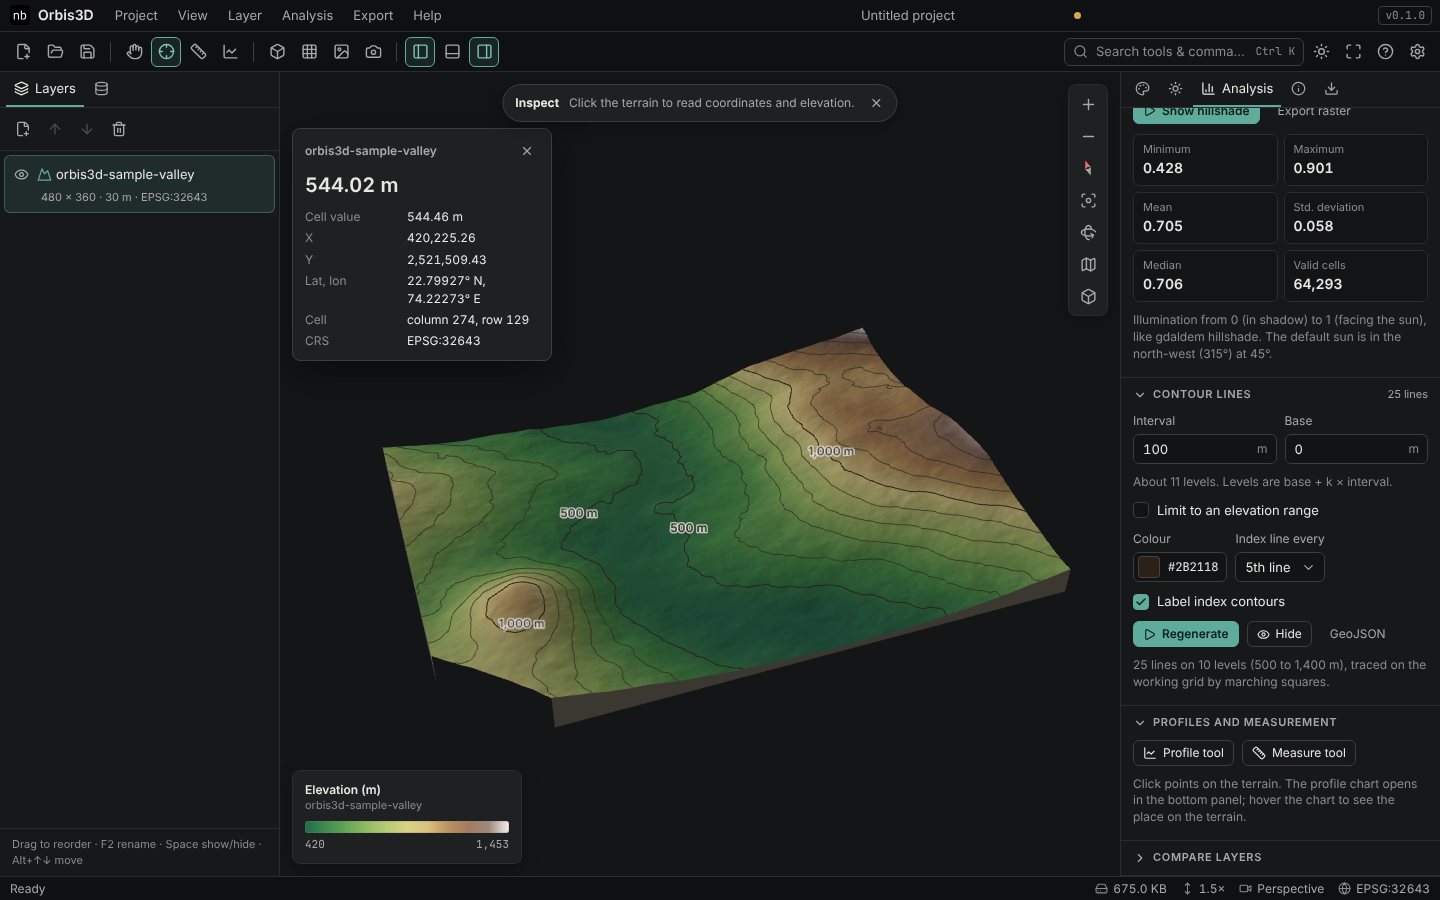
Even without a tool, the status bar shows the position and elevation under the pointer.
Measure a distance
- Choose the measure tool: the ruler button, Analysis ▸ Measure distance, or M.
- Click points along your path. A yellow line is drawn on the terrain, and the banner shows the distance.
- Read Horizontal (map distance) and Along surface (including the ups and downs) in Analysis ▸ Profiles and measurement.
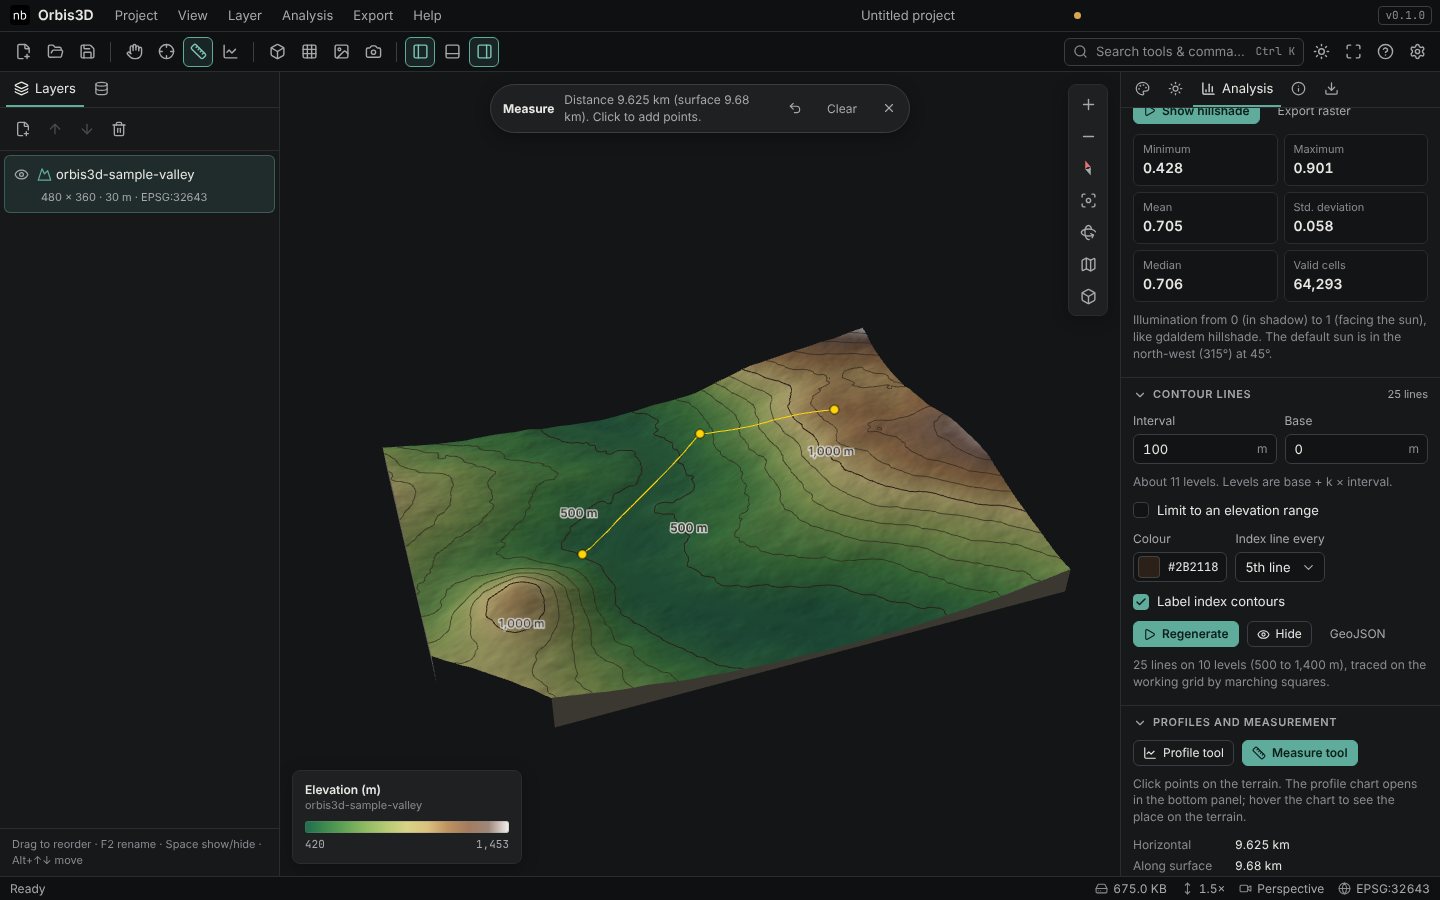
- Backspace removes the last point, Clear removes the path, Esc stops the tool. Export the vertices with Export ▸ Export measurement as CSV.
How distances are computed
| DEM coordinate system | Horizontal distance |
|---|---|
| Geographic (degrees) | Geodesic on the WGS 84 ellipsoid (Vincenty's formula) |
| Web Mercator (EPSG:3857) | Converted to latitude and longitude, then geodesic |
| Projected (UTM, national grids) | Straight line in the CRS, converted to metres |
| Unknown | Straight line, assuming metres (Orbis3D warns you) |
Projected distances include the projection's scale error, which is below 0.1 % within a UTM zone. Along surface samples the terrain along each segment and adds the vertical changes.
Expected result
You can read any point's elevation to the centimetre and measure paths in metres or kilometres. On the valley's gentle slopes the surface distance is only slightly longer than the horizontal one; on Nanda Devi it can be 10 % or more longer.
Common mistakes
- Expecting the source value everywhere. The elevation in the card is interpolated; the cell value is the stored value of the cell you clicked.
- Measuring across two layers. A measurement stays on one layer. Clear it to measure on another.